PAOC Spotlights
Visualizing Earth Science Data
The Polar Front – a 3d visualization of observations and model simulations, using IDV and Jython
![]()
How would you explain the large scale pattern of weather fronts to a general audience? Roman Kowch, an undergraduate major in EAPS, has been exploring one way; as part of a UROP project with Lodovica Illari, Chris Hill and Constantinos Evangelinos. The project involves developing 3-D visualizations of observations, laboratory experiments and numerical simulations that all illustrate the same phenomena -- large scale waves that form at the interface between a warm "equatorial" region and a cold "polar" region in a rotating fluid system. The goal is to provide (1) visual illustrations of how the balance between rotation effects and a heating-cooling gradient leads to propagating fronts and (2) connect observations from the Earth's atmosphere to laboratory and numerical experiments that students can carry out. Here we showcase some of Roman's work:
Roman's UROP:
3-D visualizations can be a powerful tool in aiding understanding of how systems works, in particular when the system in question is either of planetary scale or otherwise highly intangible like components of an ocean or the atmosphere. UROP Roman Kowch, an undergraduate majoring in EAPS, has been working with Lodovica Illari, Chris Hill and Constantinos Evangelinos to create a range of new tools for vizualizing Earth's atmosphere in 3-D.
At the heart of this project is the Integrated Data Viewer (IDV), software from Unidata, a division of UCAR (the University Corporation for Atmospheric Research). Unidata provides a broad array of data and software tools for use in geoscience education and research with the goal of enhancing educational oportunity and broadening participation.
Roman reports:
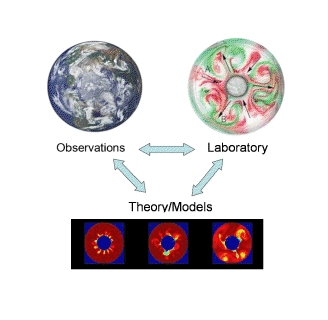
Scientists in PAOC are developing an integrated approach to the teaching of weather and climate, drawing together real-time meteorological data, laboratory experiments, and theory/numerical modeling using new Cloud computing technology,as shown schematically below:
In my UROP project I am exploring the capabilities of 3D visualization to render observational data and model fields, using IDV, the Integrated Data Viewer from Unidata, a division of the University Corporation for Atmospheric Research (UCAR). The project has allowed me not only to get familiar with atmospheric phenomena and simple numerical models but also enable me to further expand my programming skills in Python, Java and Jython.
Here are some examples of visualizations for the Polar front both from observations, a rotating fluid laboratory experiment and a model simulation.
a) Observations - a movie of the Polar front using atmospheric data, showing the dome of cold air over the pole in cyan and the associated upper level jet. The data is rendered with the IDV.
Polar Front (observations): this is a 3-D display of temperature and wind from the Global Forecast System (GFS) model in May 2010 – NOAA's National Centers for Environmental Prediction (NCEP). The data is restricted to the Northern Hemisphere (note the continents outlined at the bottom). The light blue isosurface is for potential temperature at 315 K, and slopes upward near the North Pole, showing the dome of cold air over the Pole. The vertical cross section spans the 0˚ and 180˚ longitude lines, and displays U-wind contours. Negative values (in red) depict wind flowing "out of" the section while positive values (in white) show wind flowing "into" the section. The jet stream is easily visible with the dark blue isosurface, outlining a 40m/s windspeed - animation: Roman Kowch.
b) Laboratory experiment - a movie of the Front experiment in the rotating tank, showing the collapse of a cylinder of denser fluid under the effects of gravity and rotation.
c) Numerical Model - The adjustment of denser (cold) fluid under the effect of gravity and rotation can be also represented in a numerical simulation. Here is a simulation using the MITgcm, rendered with the IDV:
Polar Front (MIT- GCM simulation): This is a 3-d visualization of a collapsing dense fluid cylinder in a rotating lab tank. The Coriolis parameter f is set at 2 s-1 and gravity is set at 10 m/s^2. The denser fluid is depicted as an isosurface of potential temperature colored in light blue and fixed at -5˚C. This feature is analogous to the cold air located near the Earth's poles. A cross section of U-wind (west-east wind) is also visible. White contours are positive U and red contours are negative U. The contour interval is at 0.5 cm/s, with highest values near 5 cm/s. The temperature gradient in this environment results in upper-level wind shear, giving rise to a high wind speed outlined in a dark blue isosurface with value 2.5 cm/s. This strong upper level flow is similar to the jet stream phenomenon of the Earth's atmosphere - animation: Roman Kowch.
The use of IDV graphics for both observations and models highlights the similarities between the simulation and the real world. In the simulation, cold air over the pole slumps equator-ward under the effect of gravity and rotation and adjusts into a dome shape. The warm air sliding on top of the cold air moves towards the Pole, acquires angular momentum and spins up in the same sense as earth rotation. The resulting winds increase with height with a marked upper level jet, blowing from west to east. This is very reminiscent of the observed Polar front and associated strong upper level westerlies, as the IDV graphics reveal.
IDV is a Java based graphics package but I am currently exploring the possibility of running IDV in “background mode”, more compatible with the Cloud computing infrastructure. This has not been done before and requires some interesting programming with Jython (a mix of Java objects/methods with Python structure). Writing these scripts is challenging, but I enjoy the anticipated benefits from my work. After testing the scripts, the IDV graphics will be ported to a user-friendly web interface allowing users to make their own images and experience IDV’s graphics. A cloud computing environment will be implemented to handle the data processing with ease and speed. Once this occurs, IDV will become a free online tool that faculty and students can use to explore and understand weather and climate phenomena
Asked about his UROP experience, Roman says: "Writing these scripts is challenging, but I enjoy the anticipated benefits from my work. Future classes in meteorology, including those at institutions other than MIT, should find that IDV is a powerful tool in visualizing the atmosphere and understanding the connections between models and observations." Once ready, the scripts Roman is working on will be ported to a user-friendly web interface allowing users around the globe to make their own images and experience IDV's graphic capabilities. A cloud-computing environment will be implemented to handle the data processing with ease and speed after which it is envisaged that IDV will become a free online tool that faculty and students can use to explore and understand weather and climate phenomena.
For more see:
CITE: Cloud-computing infrastructure and technology for education (C. Hill, J. Marshall, G. Flierl and L. Illari)
and
Planet-in-a-Bottle (S. Ravela, J. Marshall and C. Hill)-
References
Integrated Data Viewer (IDV) from UNIDATA. Website.
C. Hill, J. Marshall, G. Flierl and L. Illari. CITE: Cloud-computing infrastructure and technology for education. Website
Lodovica Illari and J. Marshall, Weather in a Tank – The Front Experiment .
S. Ravela, J. Marshall et al.: A Realtime Observatory for Laboratory Simulation of Planetary Flows, Experiments in Fluids, 48(5):915-925, 2010.