PAOC Spotlights
Tracking Radium in the Arctic
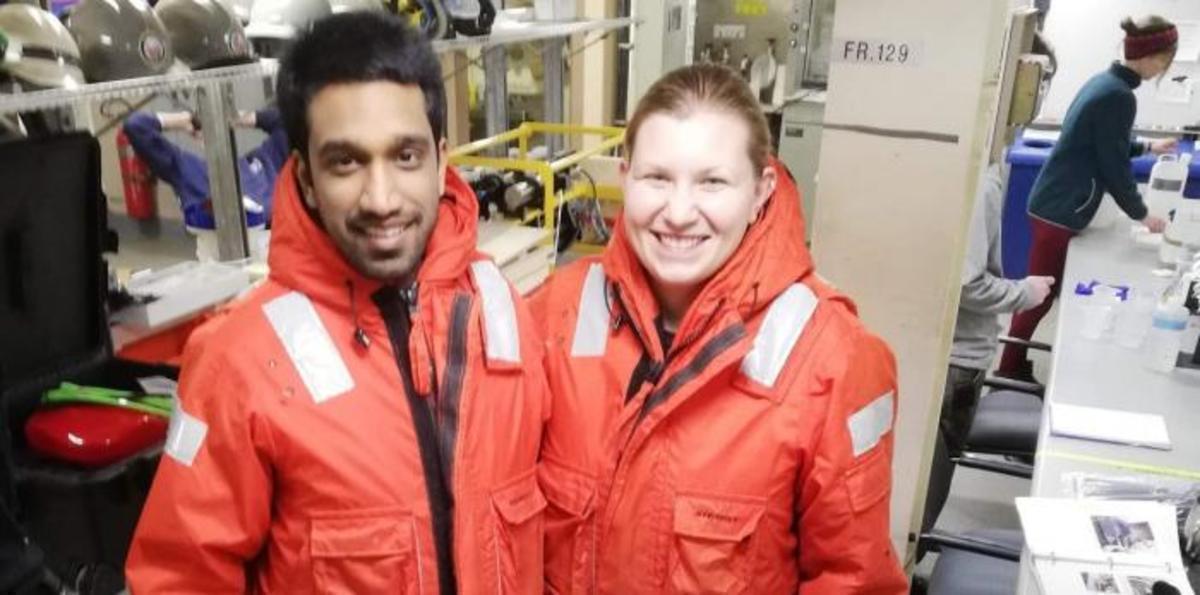
Jessica Dabrowski is an ocean chemist and a second-year graduate student in the MIT/WHOI Joint Program in Oceanography and Applied Ocean Sciences & Engineering. She travelled to the Arctic for a late season research cruise in October-November 2018. She hopes to use the data she collected to understand the impact of climate change and seasonal cycles on the Arctic Ocean as radium concentrations change in the water.
Read this story at Oceanus Magazine.
What brought this research cruise to the Arctic?
This is a regular research cruise led by WHOI physical oceanographer Bob Pickart to retrieve data from a mooring that is monitoring the shelf-break jet in the Beaufort and Chukchi Seas north of Alaska. The mooring is changed out during these cruises as well. Even though this cruise happens every two years, this is the latest in the year that WHOI scientists have done this survey in the Arctic. We were on U. S. Coast Guard Cutter Healy, a polar icebreaker.
Most scientists were on the cruise because they are interested in seeing what the currents are doing at this time of year. I was there because I wanted to use a method involving the tracking of water with radium isotopes to see how much water is moving from the shallow area near the coast, entering or crossing the shelf-break jet, and entering the deep ocean.
What is the shelf-break jet?
Because of the way the Earth spins, currents turn to the right in the Northern Hemisphere and hug the shoreline. We call this current a shelf-break jet because it is fast-moving and hangs out at the edge of the continental shelf. In the Arctic, it runs north through the Bering Strait and then east along the northern part of Alaska’s shelf. The current acts like a wall so water coming from the coast doesn’t typically enter the central ocean.
For nutrients, carbon, or anything else to travel from land to the middle of the Arctic, there needs to be some kind of exception to the typical flow of the shelf-break jet, such as a storm or a change in wind direction. The fall and winter are known for storms and other weather events that can create these exceptions.
Why are you interested in how much water moves from the shallow areas into the deep ocean?
The water close to land is full of nutrients and the whole food chain in the Arctic Ocean depends on them. Phytoplankton consume the metals, nitrogen, and phosphorus, then the phytoplankton are eaten by zooplankton, which are eaten by fish and whales in this region. The Beaufort and Chukchi Seas have really active ecosystems with lots of whales, lots of seabirds, and phytoplankton blooms.
Most methods of observation rely on having instruments in the water in precise locations where cross-shelf transport happens. Radium isotopes can tell me if it happened, and how long ago, without being there exactly when the transport occurred.
How does radium tracing work?
Radium comes from sediments and soils and rocks. When radium enters seawater it dissolves and travels with the water. It doesn’t react with much and there is little biological consumption of radium, so it doesn’t really change over the shorter time scales I’m interested in. We call it a tracer because it allows us to trace the processes and movement of the water and all it carries with it.
Because radium is a radioactive element and decays at a rate that we know, we can use it like a stopwatch. We know that at time zero, radium isotopes came out of the sediments and into water that is on the shelf or near the shore. There are four different isotopes of radium that all come from sediments, and we know their half-lives (or the amount of time it takes for half of the original radium to decay). If we see radium 100 meters from shore and it has gone away by a certain amount, we can calculate how fast the water is moving based on the isotope’s half-life. It’s similar to the way we can calculate how fast a car is moving if we know how far it’s gone and how long it took to get there.
Radium also gives you amounts. Not just the amount of water coming out of the sediments, but also nitrogen, carbon, methane, and any nutrients that are coming from the sediments and into the water column. Knowing these amounts is important for understanding the impact of cross-shelf transport on the Arctic ecosystem.
How much radium tracing has been done in the Arctic?
There is a lot of data on radium isotopes and their use as tracers in the Atlantic and Pacific Oceans—basically in the temperate and tropical zones—but not much in the Arctic and not much near shore in these close shelf regions.
From the Arctic GEOTRACES cruise in 2015, we know that radium has increased in the middle of the Arctic Ocean at the North Pole, and we know that radium comes from the land and from these shallow shelf areas. So that means something is happening on these shelves in these shallow areas. I want to find out what time of year it’s happening and how it is changing. These changes have big implications for the carbon cycle in the Arctic and for the whole Arctic ecosystem.
What was it like sampling at this time of year?
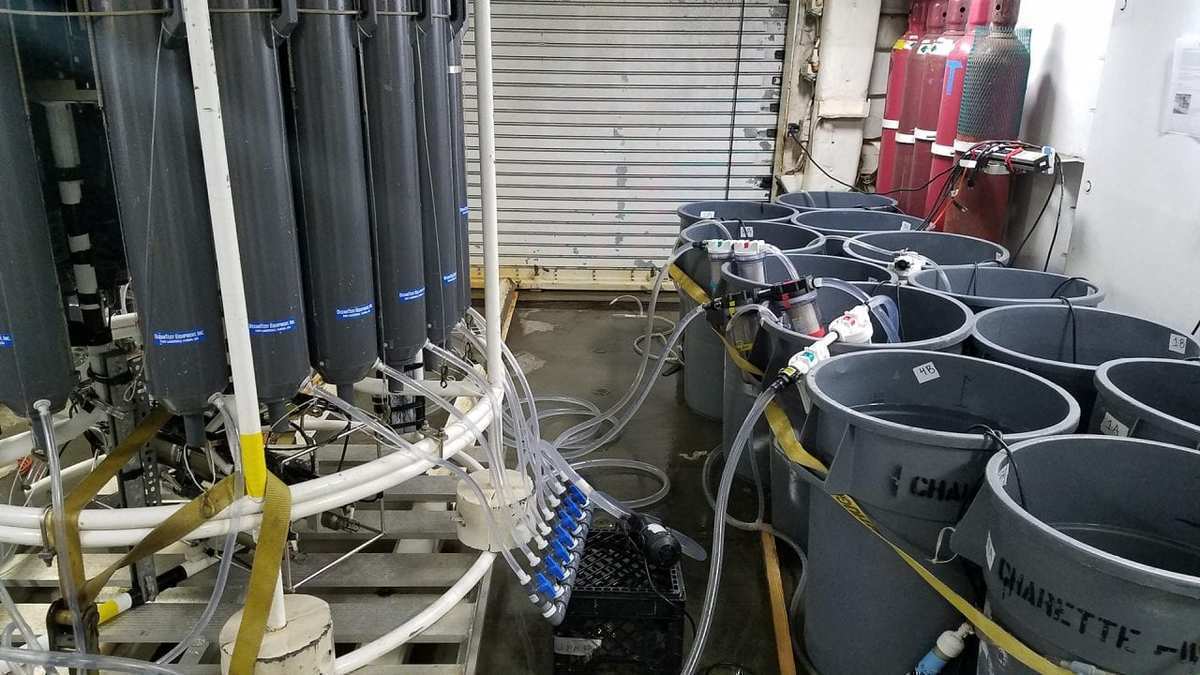
My sampling is really laborious because radium measurements require a large volume of water. Since we were there so late in the season, it was 30 degrees below Fahrenheit at times! Water would freeze as soon as it hit the air. Luckily, I could bring my samples inside to empty them into my holding containers, but there were times I had to wait for the water to thaw next to heaters before I could pump it out of our sampling bottles.
When the ice was very thick in the eastern Beaufort Sea, we were sampling along openings in the ice, or leads, and the captain was using eyesight to do that, so we had to work fast before the sun set—which was really hard because at that time of year the sun rises at 12:00pm and sets at 2:00pm with only a couple hours of dawn and dusk outside of those hours. We were surrounded by lots of ice so that meant if we were sending the instruments down to collect water, the ice was moving, and closing in on the instruments while they were down in the water. We had to speed up our sampling tactics or pull out the instruments early.
I had about twenty minutes between sampling locations and over that time I would be filtering my water samples and then measuring the radium on the filters with my instruments. My samples would need to be measured for 6 hours and attended to every 3 hours. There were a couple of weeks where I was only sleeping two or three hours at a time.
What did you get from your samples?
I don’t have all the data yet. But generally, I see that radium is a lot higher on the shelf and in these shallow waters than it is farther out from the shelf in deeper water. It is also a lot higher closer to the sediments than at the surface. Which is as I hoped it would be—so I can use it as a tracer of what is coming out of the sea floor sediments.
What are your next steps?
This has been my second project using radium isotopes in a polar or high latitude region. I am hoping to use them more because there hasn’t been a lot of work done in the Arctic Ocean or Arctic rivers using these tracers compared to other parts of the world. We can learn a lot about basic processes like cross shelf transport, nutrient inputs into the Arctic, and the amount of river transport into the central Arctic. I am hoping my measurements can provide an additional timepoint in the under-sampled fall season so that in comparing to the other measurements we can understand both seasonal differences and the impacts of climate change in the Arctic.