PAOC Spotlights
The Science behind Boston's Record-Setting Winter of 2015
The winter of 2015 will likely become the snowiest Boston has ever seen. MIT Meteorologist Lodovica Illari shares her thoughts on the science behind these extreme weather events and what caused them.
***
In the first two months of the year, six major snow storms hit Boston and buried it under almost nine feet of snow. It is now March and Bostonians are still digging themselves out. The last time the city weathered such harsh conditions was two decades ago, which saw approximately nine feet of snow over the entire season. With just two inches of snow needed to beat the record, the winter of 2015 will likely become the snowiest Boston has ever seen. Lodovica Illari, a meteorologist in MIT’s Program of Atmospheres, Oceans, and Climate, shares her thoughts on the science behind these extreme weather events and what caused them.
TOP 5 SNOW SEASONS in Boston
1995-96: 107.6"
2014-15: 105.7"
1993-94: 96.3"
1947-48: 92.5"
2004-05: 86.6"
Why were there so many snow storms in Boston this year?
The large-scale flow over the U.S. has been very unusual this winter, and in an ideal configuration to favor winter storms over the East Coast.

The jet stream—a current of rapidly moving air that carries weather systems across the globe— has been zonal over the Pacific Ocean but split into two branches near the west coast of the U.S. due to a “blocking” dipole, a stationary pressure pattern that redirects the stream. As a result, the jet stream becomes very wavy and is in an ideal configuration to bring warm air north over the west and cold air south over the continental U.S.
Once a blocking pattern is established, it often lasts for weeks or even months. In fact, nearly all of the snow storms this season followed very similar tracks and had marked similarities in their synoptic evolution. This winter, the blocking dipole formed in the middle of January as the result of a very active Pacific storm track. A sequence of low pressure systems moved along the Pacific jet, growing along the way and maturing near the west coast. The following infrared (IR) satellite image and surface pressure map show storms in the Pacific on January 15th approaching the west coast.

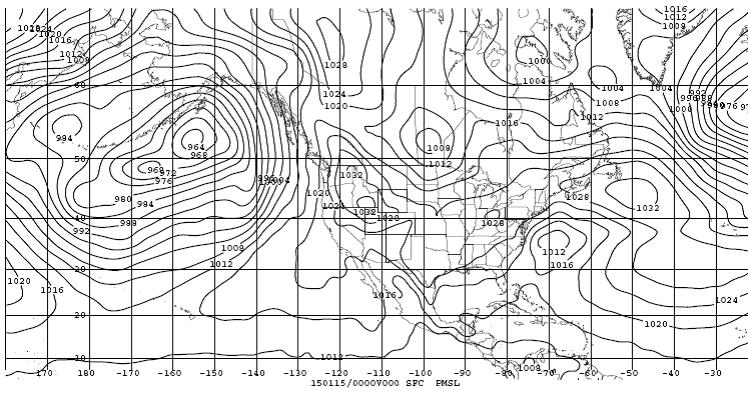
Satellite cloud (IR) images show strong low pressure systems at the end of the Pacific storm track, advecting warm moist air towards the west coast. This coincides with the establishment of the Blocking High; see the high pressure building up over the west coast in Fig. 2b. Once in place, storms are forced to move north around the high and then south along the jet which is now beginning to orientate itself north-south, encouraging storm development over the eastern U.S. (Fig. 1). Disturbances developing downstream of the blocking dipole are forced to move south and then east towards the Gulf region where they interact with the warm ocean and develop into strong surface lows over the east coast, causing record snow falls over Boston.
Is this winter unusual compared to previous winters?
In the wintertime, we often observe in the jet stream a pronounced ridge over the west coast and a trough downstream. The term ‘RRR’, which stands for Ridiculously Recurrent Ridge, was coined in 2013 by Stanford University Ph.D. candidate Daniel Swain to label a ridge over the west coast that 'does not want to go away'. Blamed for persistent drought over the west coast, this year the ridge has been particularly pronounced and was positioned further downstream of the Rockies. Utah, Nebraska and even Colorado were affected by the high pressure system, and experienced record high temperatures for winter 2015.
The warmth over the western U.S. is the precursor to a stormy east coast. The persistent high pressure over the west forces the jet stream to flow south and then curve back north over the east coast, setting the scene for severe weather. Low pressure systems along the northward flowing jet gain energy from the warm ocean (marked by the W in Fig. 1) and mature over our region. Here in Boston, very cold arctic air was already in place leading to the precipitation falling as snow.
The first major snowfall of 2015 occurred on January 27. The observations show a blocked flow with warm air over the west coast, accompanied by a pronounced cold trough downstream (Fig. 3a). This results in a low pressure system developing over the east coast. A warm west and a cold, snowy east often go together. In fact, severe winter blizzards over New England are often associated with blocking and warmth over the west coast and a wavy meridional jet over the rest of the continental U.S. If we look back 10 years to the blizzard that hit Boston on January 23, 2005, the pattern looks strikingly similar to the January 27, 2015 blizzard (Fig. 3b). The only unusual aspect of this winter is the frequency of the storms, which is due the persistence of blocking.


A more complete synoptic description and comparison of the blizzards of January 27, 2015 and January 23, 2005 can be found here.
Are these extreme weather events related to global climate change?
We know from our own Paul O’Gorman’s work that as the world warms, we expect to observe a decrease in average snowfall, but extreme snowfalls are likely to increase. We therefore shouldn’t be surprised at experiencing increased heavy snowfall. His argument is based on thermodynamic considerations and a statistical analysis of IPCC models outputs, however. Such considerations, although very powerful, do not predict precisely when or where such severe snowfall might fall.
Jennifer Francis of Rutgers University proposes that in a warming world the jet-stream becomes wavier and blocking highs more frequent. She argues that the warming Arctic reduces the pole-to-equator temperature gradient, slowing the jet stream which therefore meanders north-south more, occasionally bringing extreme cold and snow down to New England. At the same time, the Western U.S. experiences unseasonal warmth.
Instead, Elizabeth Barnes of Colorado State University studied 30 years of data and did not find any increased incidence or duration of blocking, directly challenging Francis’ idea. The picture is clearly complicated and, as I now briefly describe, tropical influences could also be at play.
****
This winter we have noticed a very strong zonal Pacific jet and a wavy meridional jet downstream of the blocking pattern. But it isn’t wavy everywhere and also exhibits local influences. In the past few months, sea surface temperature has been increasing over the Pacific, suggesting that we are entering an El Niño year. Indeed, January and February were unusually active with several tropical cyclones. For example Mekkhala became an early-forming storm of the season and affected the Philippines. Less than a month later, Typhoon Higos was one of the strongest February typhoons of record.
This strong tropical activity could be a sign of an enhanced north-south temperature gradient and a stronger Pacific jet. As a consequence, we might expect enhanced baroclinic activity with stronger cyclones at the end of the Pacific storm track. This will favor the forming of a blocking dipole and the accompanying meridional flow over the Continental US – the ideal configuration for big storms over the East coast.