PAOC Spotlights
Relating Marine Picoplankton Cell Size and Metabolism
Read this at CBIOMES
In his work for CBIOMES John Casey is developing and applying optimization tools to integrate environmental, physiological and ‘omics measurements from cultivated and natural microbial communities into a network-based computational framework with the goal of developing quantitative systems-level predictions of phenotypes, activities, and interactions within marine microbial communities.
In a paper appearing in the journal Limnology and Oceanography, Casey together with co-authors Karin M. Björkman, Sara Ferrón, and David M. Karl at the Daniel K. Inouye Center for Microbial Oceanography, University of Hawai’i at Mānoa, Honolulu report work probing the relationship between cell size and metabolism within marine picoplankton populations in the surface North Pacific Subtropical Gyre.
“The empirical scaling of maximal metabolic rates with body size has been carefully studied for nearly two centuries,” Casey explains. “When organisms spanning more than 20 orders of magnitude in body size are compared, all the way from single cells to blue whales, a mass-specific scaling emerges which fairly accurately predicts metabolic rates.”
He continues, “The size structure of the majority of marine picoplankton, however, is narrow and beneath the lower size limit of that empirical relationship (typically <1 μm). We decided to take a closer look beyond the lower end of this scaling to probe whether it still holds for sub-micrometer organisms.”
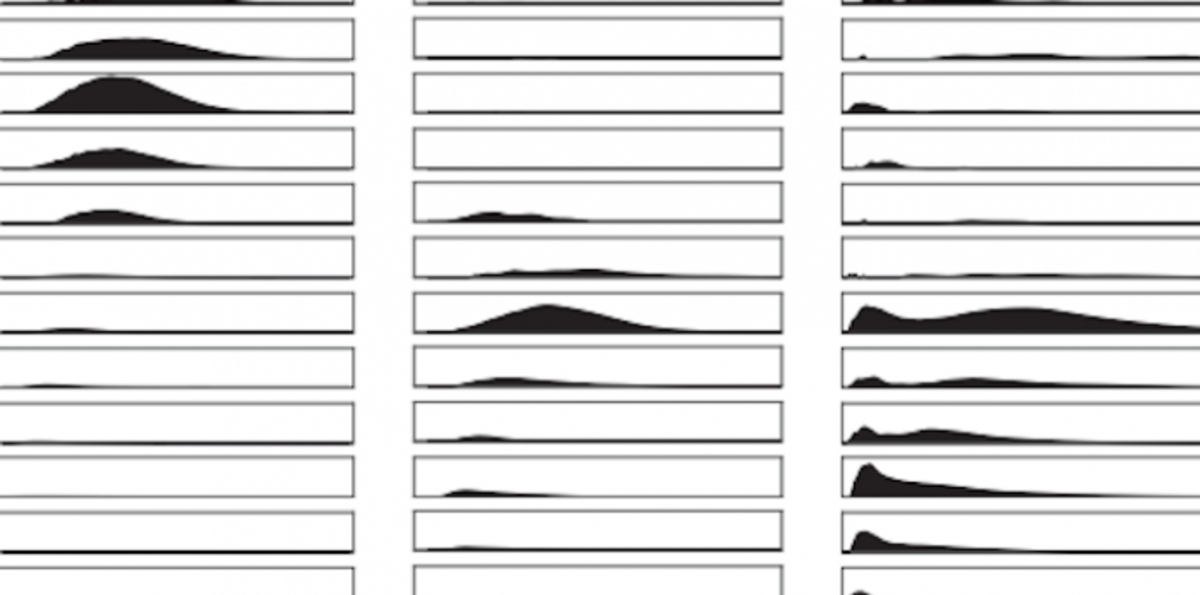
In their study, Casey et al developed a method to quantify the carbon-specific activity of cells that are finely size-fractionated from their natural populations. The seawater samples are incubated with radioisotope tracers of primary production and growth, filtered at fine-resolution (0.05 μm increment), and analyzed by flow cytometry. Using flow cytometric conversion of light scatter to cellular carbon quotas (a technique Casey developed during his time at the Bermuda Institute for Ocean Sciences) to quantify the group-specific carbon retained on each filter, the team measured median carbon quotas for populations of the cyanobacterium Prochlorococcus
When combined with radioisotope tracers, they were able to quantify the size dependence of metabolic activity of picoplankton populations in the 0.10–1.00 μm size interval within the microbial assemblage observed during a pair of field expeditions at Station ALOHA (22.45N, 158.00W), the site of a broad range of oceanographic studies, including the Hawai‘i Ocean Time-series (HOT), Woods Hole Oceanographic Institution moorings, and the ALOHA Cabled Observatory.
“In contrast with the positive power scaling observed at larger scales, the carbon-specific rates of primary production as a function of cell size we found within the populations of Prochlorococcus and heterotrophs displayed negative power scalings, suggesting the presence of within-population variability in cell physiology and metabolism for these important microbial groups,” says Casey. “We wonder if cells may regulate their metabolic rates as they age and progress through the cell cycle, overriding the allometric power law. There is some evidence coming out about yeast which raises that possibility, and it really deserves a deeper look.”
“Allometric scalings are a linchpin of the metabolic theory of ecology,” says Casey. “Ecologists use them to estimate maximum intrinsic growth and substrate transport rates, parameters which lay the foundation for a wide array of ecosystem models. They also provide important constraints on elemental stoichiometry in “trait-based” ocean ecosystem models like Darwin, helping reduce model complexity in favor of allowing more biological detail to be included while keeping the model tractable.”
“By implementing improved parameterizations based on research like that reported in Casey et al we are working to develop new trait-based models and simulations of regional and global microbial communities,” says CBIOMES Director Mick Follows. “We expect these improved models to lead to improved global ocean-scale predictions and regional state-estimates, constrained by observed biogeography, that will help us more accurately quantify associated biogeochemical fluxes.”
Casey received his BS from the College of Charleston in 2007, joining the Bermuda Institute of Ocean Science as a technician from 2007 to 2010. He received his PhD from the University of Hawai’i in 2017 with advisor David Karl for research exploring the dynamics of marine microbial metabolism and physiology at Station ALOHA. Casey relocated from the University of Hawai’i to MIT in June 2019.
The Simons Collaboration on Computational Biogeochemical Modeling of Marine Ecosystems (CBIOMES, pronounced “Sea Biomes”) is a multi-institution effort seeking to characterize biogeography of key marine microbes at basin and seasonal scales, to ask how organismal characteristics and interactions shape these patterns, and to understand and quantify the relationship between biogeography and elemental cycles. To this end the team is developing models that represent key traits of marine microbes, compiling and interpreting diverse observational datasets, and formally combining data and models in order to map out microbial biogeography, interpret the organizing principles, and infer large-scale biogeochemical fluxes.
The project brings together an eclectic, multi-disciplinary group of investigators from oceanography, statistics, data science, ecology, marine biogeochemistry and remote sensing from institutions across the US, the UK and Canada.
Story Images: Histograms of cell carbon quotas retained on eachfilter, as an average of three replicates. Columns of histograms correspond to ProchlorococcusMIT9301 (left column), Station ALOHAProchlorococcus (middle column) and heterotrophs (right column). (Credit: Casey, J., K. Bjorkman, S. Ferron, D. Karl (2019))