PAOC Spotlights

Nautical Day at the MIT Museum

Wed February 27th, 2019
Kelsey Tsipis | Program in Atmospheres, Oceans and Climate
3Game.jpg (Full)
MIT Museum’s 2019 Nautical Day. (All photo credits: Kelsey Tsipis)


"Can we eat them?"

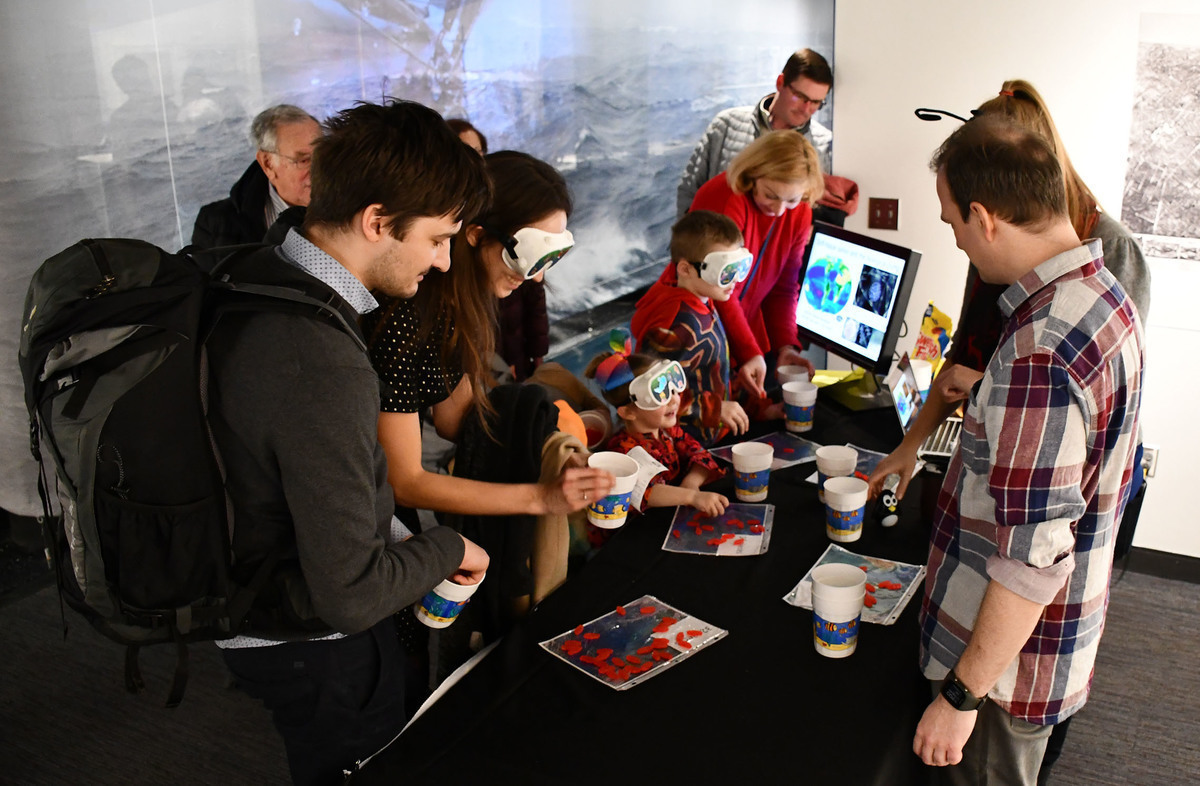
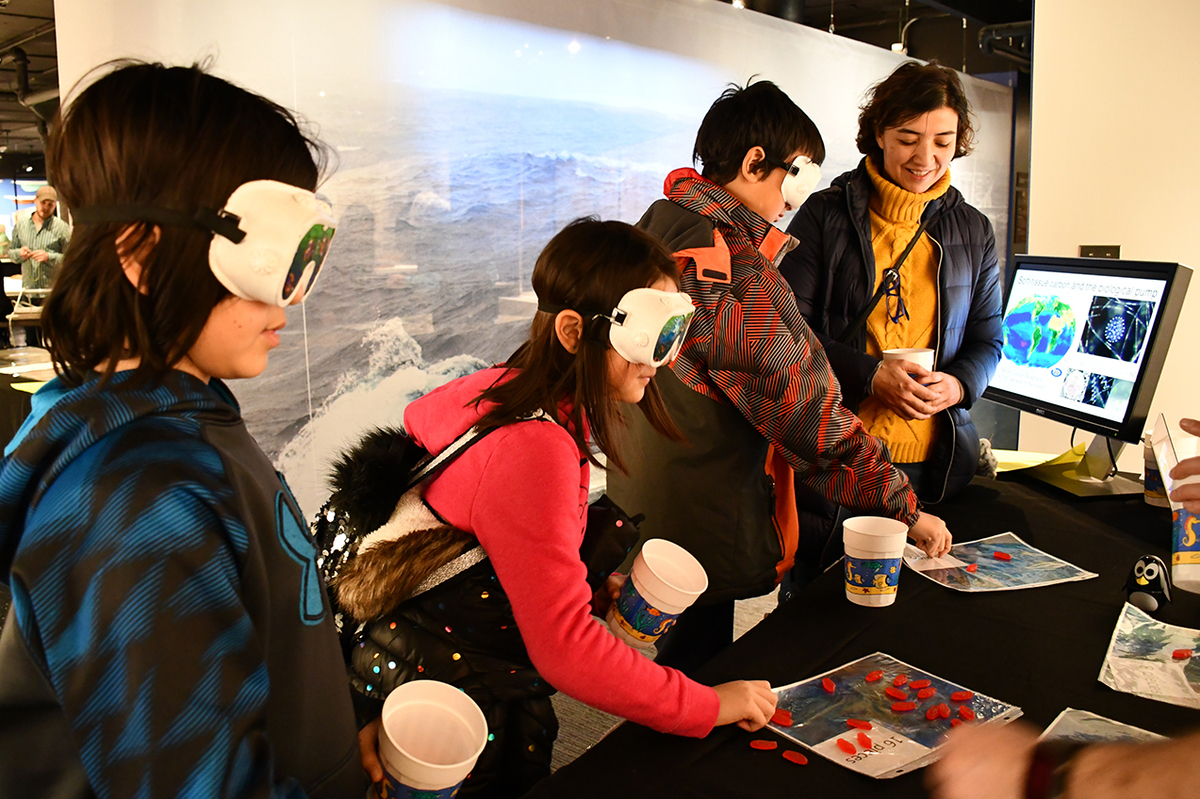
This is not a question asked often of Jonathan Lauderdale and Maike Sonnewald, postdocs in MIT’s Department of Earth, Atmospheric and Planetary Sciences (EAPS) and Program in Atmospheres, Oceans and Climate (PAOC) members. But this past Saturday, February 23, 2019, Lauderdale and Sonnewald presented at the MIT Museum’s 2019 Nautical Day, an annual event that offers hundreds of guests from the greater Boston area hands-on lessons in ocean and climate research.

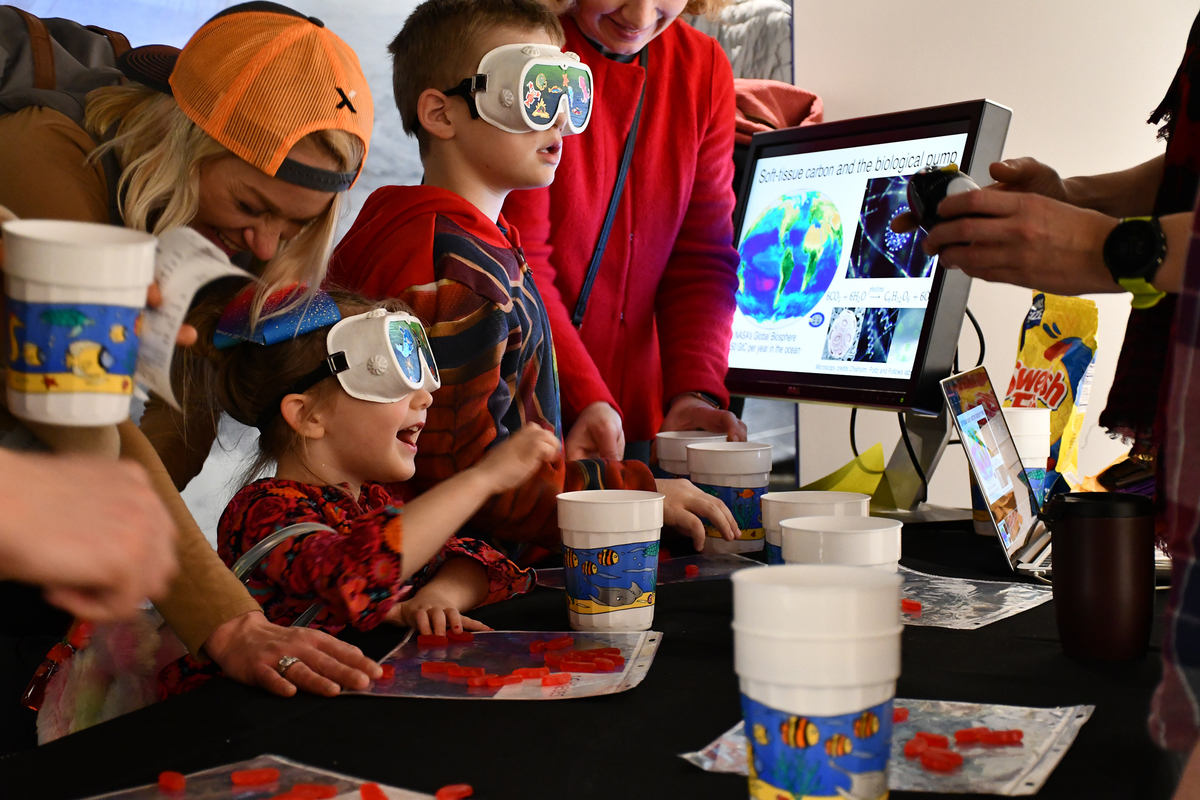
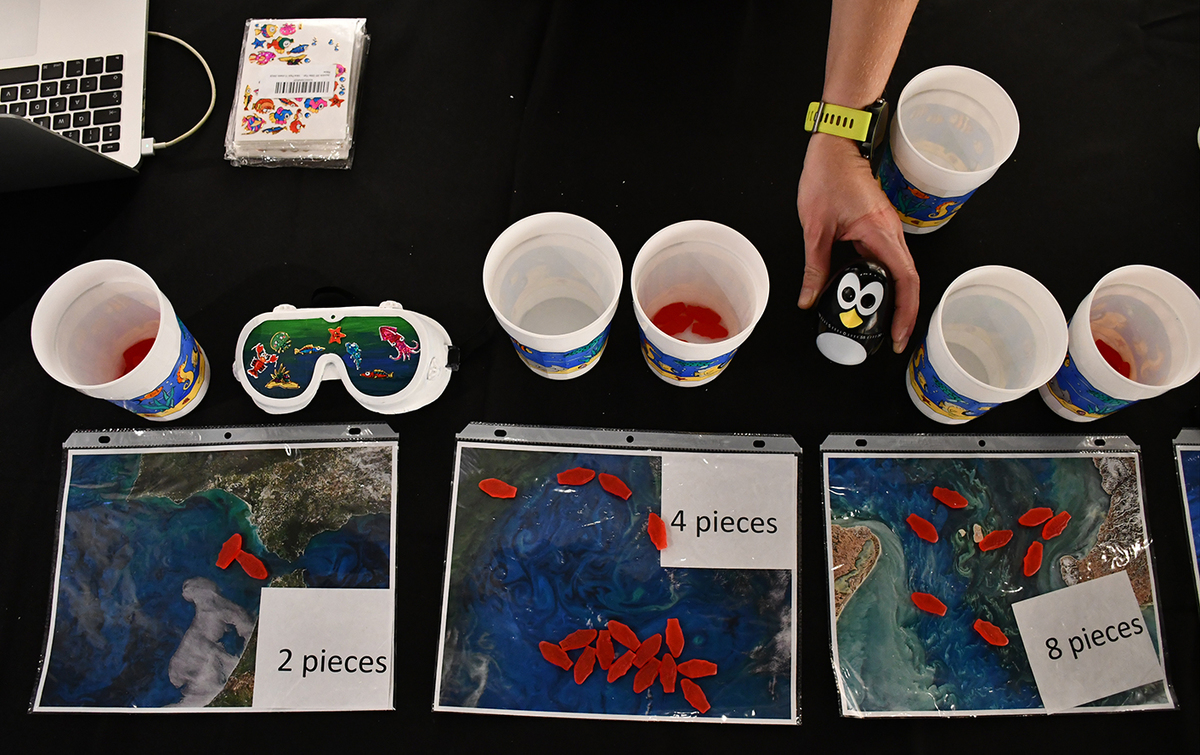
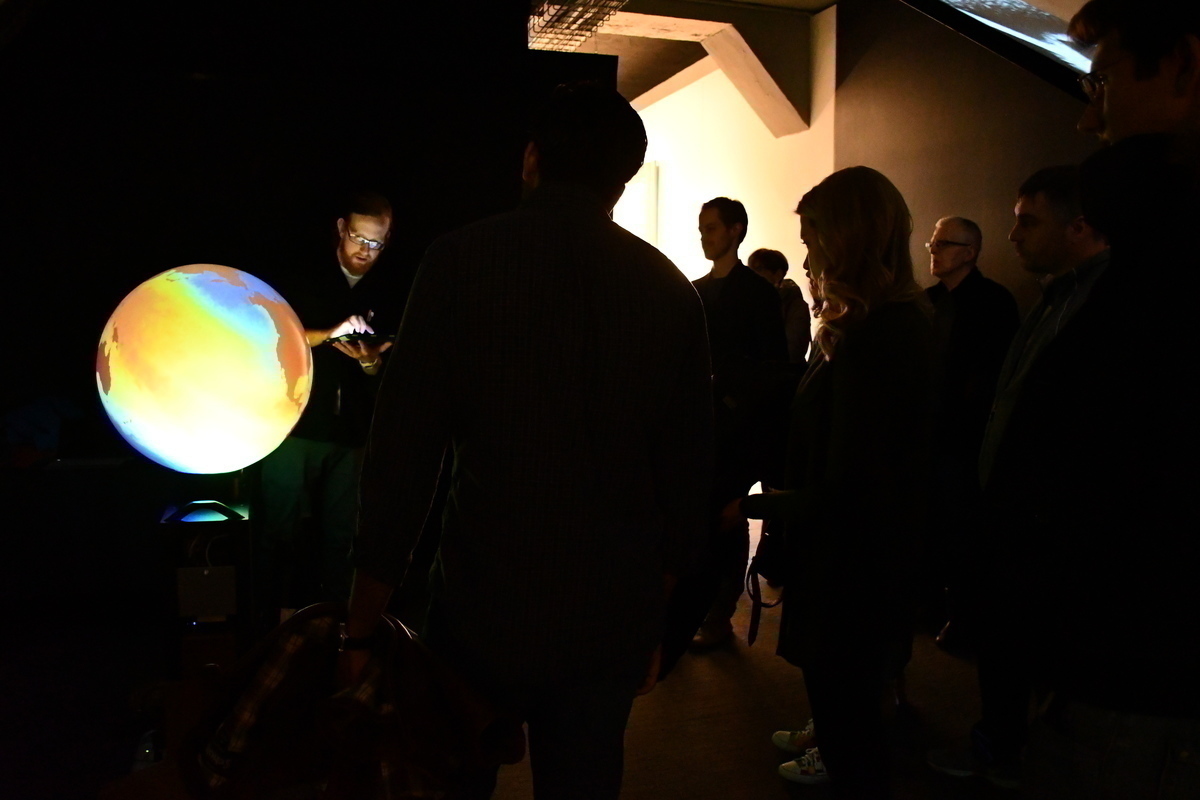
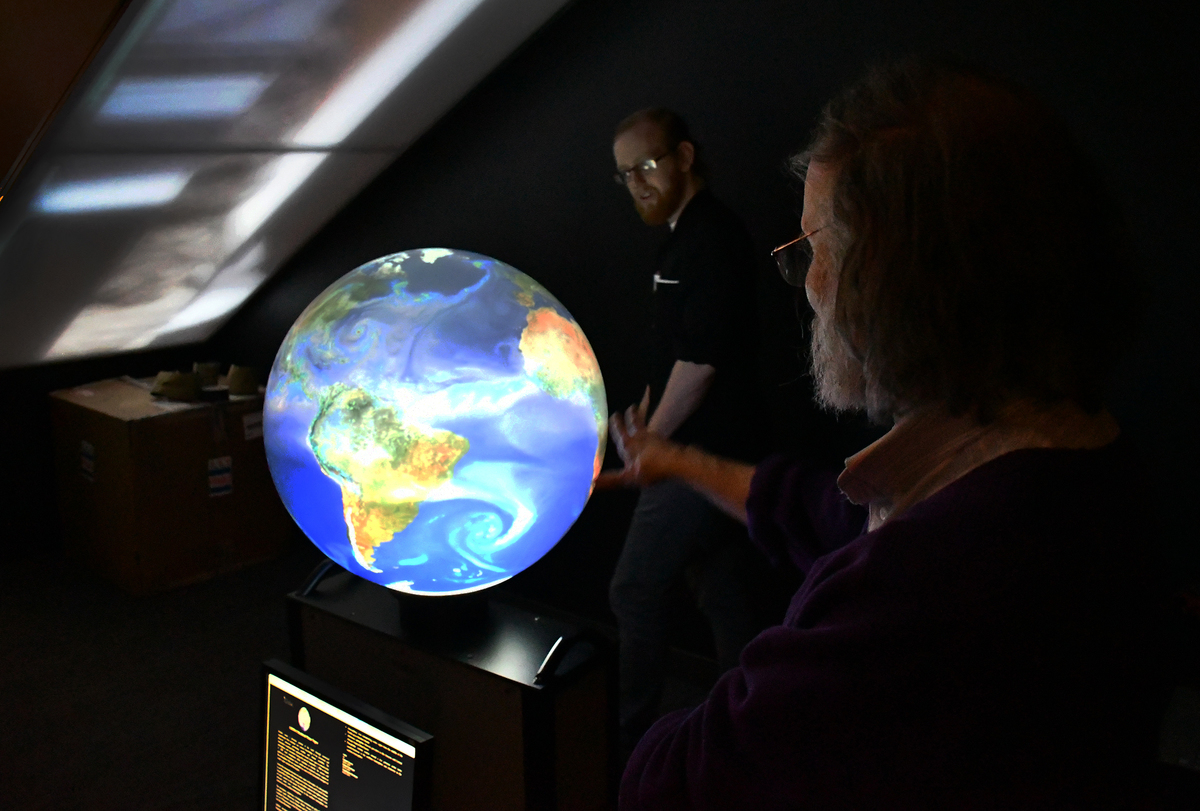
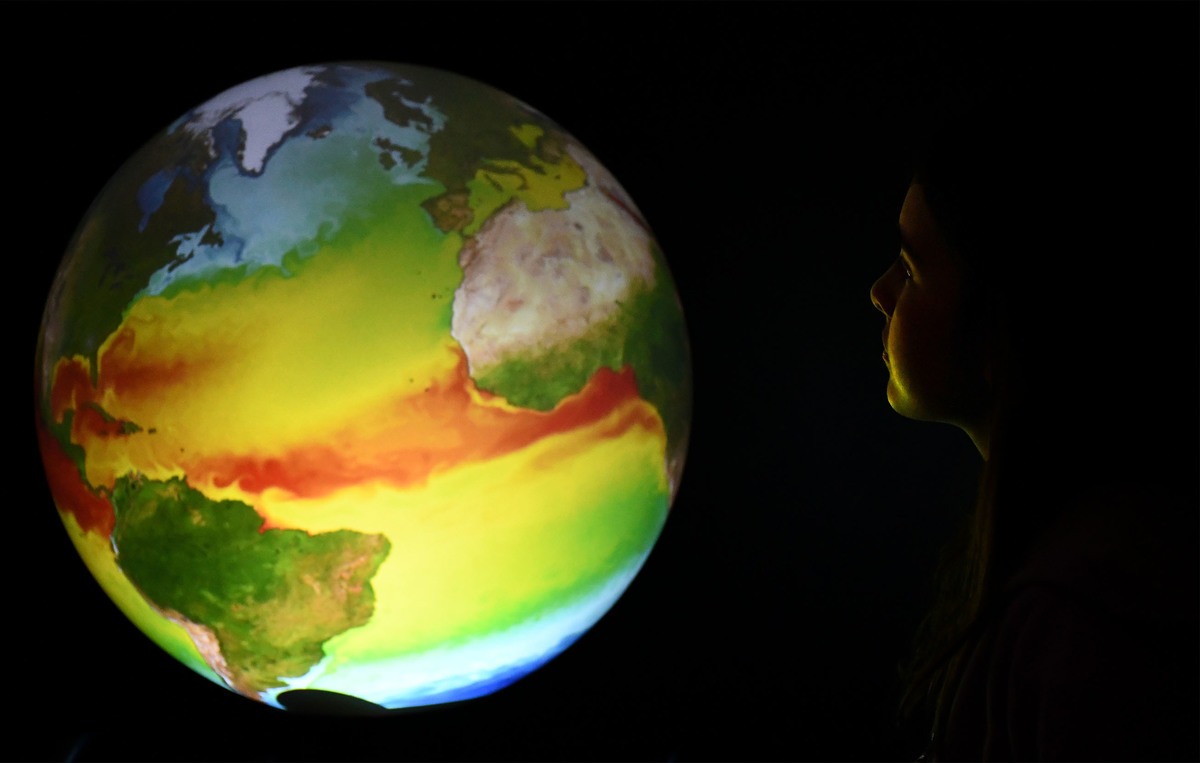
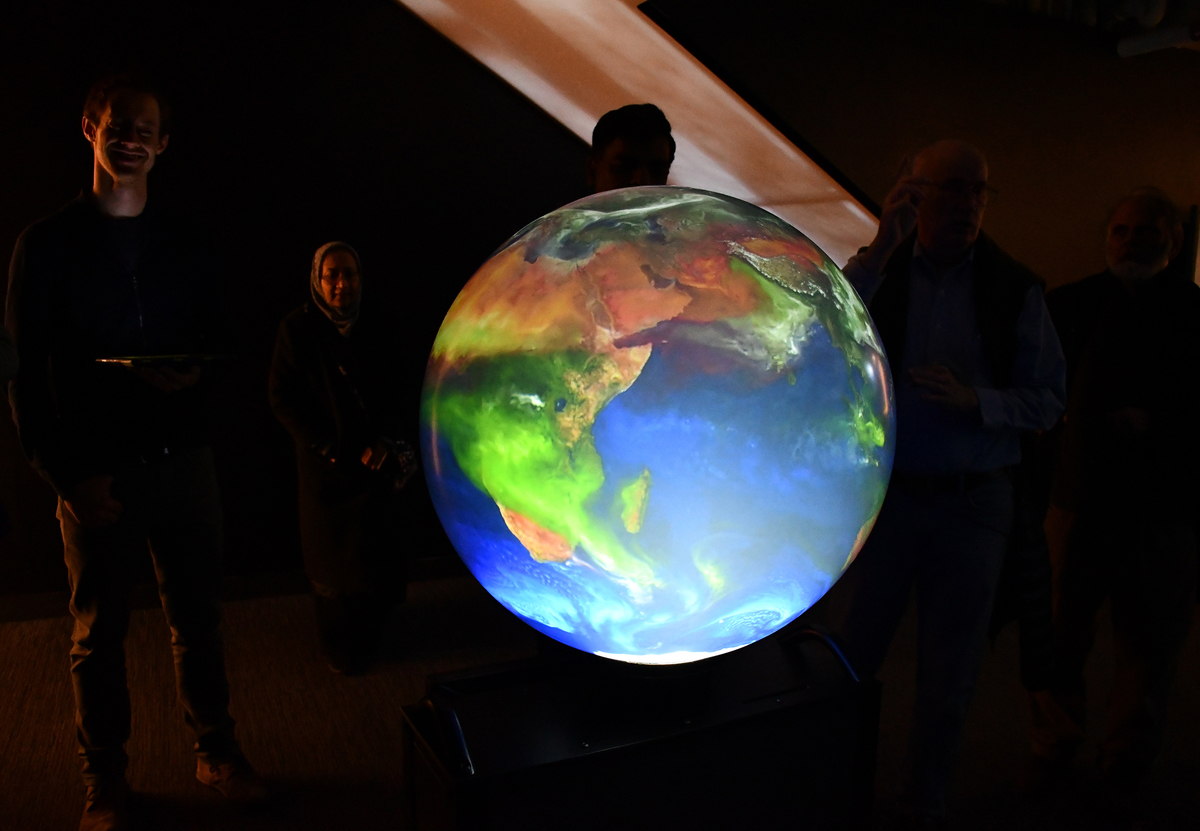
In one of two ocean-themed attractions hosted by PAOC members this year, Lauderdale and Sonnewald used a simple Swedish Fish game to model connections between food abundance and predator consumption, inspired by principles put forth by ecologist Crawford Stanley (Buzz) Holling. In the second attraction, just across the hall, attendees experienced the mesmorizing graphics of iGlobe, an illuminated 2-foot sphere with a rotating display of maps and data visualizations related to climate and environmental concerns, hosted by Bill McKenna, a researcher and technician in the Synoptic and Fluid Labs in EAPS, Samuel Levang, graduate student in the Flierl group, and Glenn Flierl, EAPS Professor of Oceanography.

This was the seventh consecutive year that PAOC members participated in Nautical Day, and both interactive lessons drew big crowds of all ages. Guests may have been lured in by the candy or spellbinding graphics but they left with a new appreciation of weather, oceans, or climate science. The following photos give a glimpse into what they experienced.


1_Maike copy.jpg (Full)
Postdoc Maike Sonnewald explains the rules of the popular “bugs to bytes” game.


1Game.jpg (Full)
In the Swedish Fish game, five placemats representing different regions of ocean were laid out with either 2, 4, 8, 16, or 32 "prey."  


2Game.jpg (Full)
The blindfolded guests, the "predators," hunted for prey in 1-minute intervals by lowering two fingers in a pincher position onto their placemat. 


6Game.jpg (Full)
If the "predators" (blindfolded guests) landed on a "prey," they were instructed to bring their hand back up to shoulder height, exclaim "nom nom," and drop the fish in their empty cup (their "stomach"). 


4Game.jpg (Full)
Meanwhile, non-blindedfolded partners replaced each fish that the predator caught, so the food level remained constant throughout the 1-minute interval.


7Game.jpg (Full)
After 1 minute, guests removed their blindfolds and counted up their catches. Lauderdale and Sonnewald then plotted the number of Swedish Fish caught against the number of fish available for hunting. Above is a graph showing the raw data for the first seven games of the day. 


8_Jon.jpg (Full)

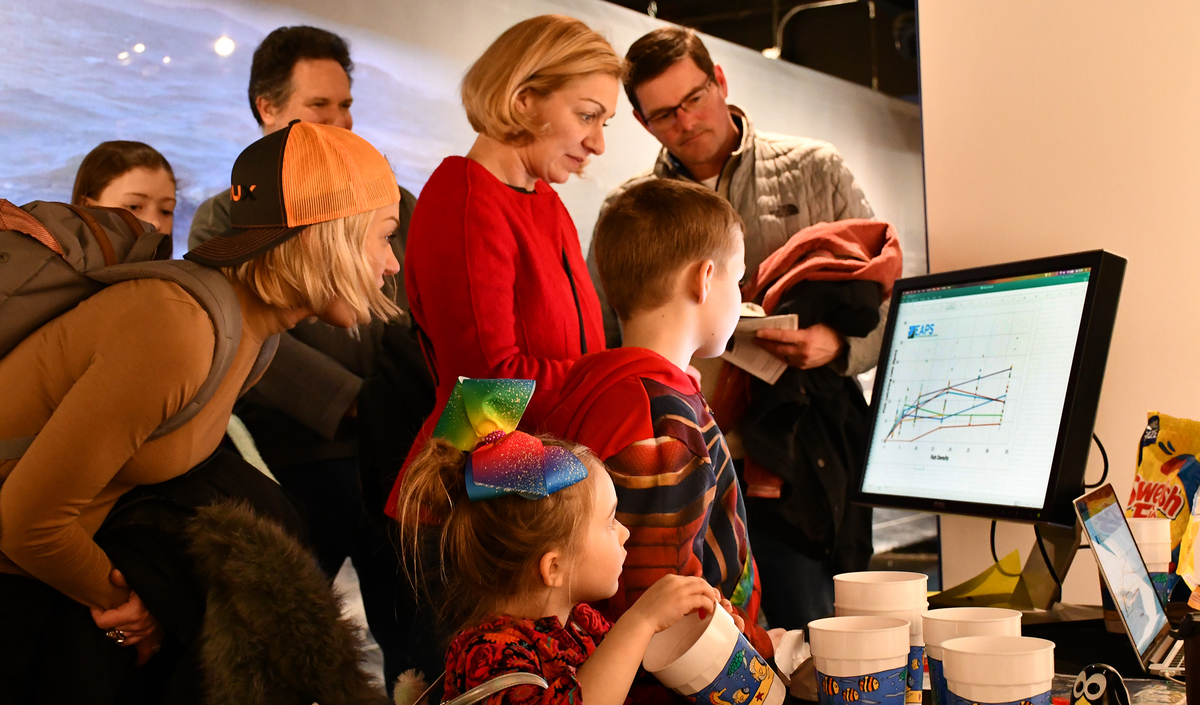
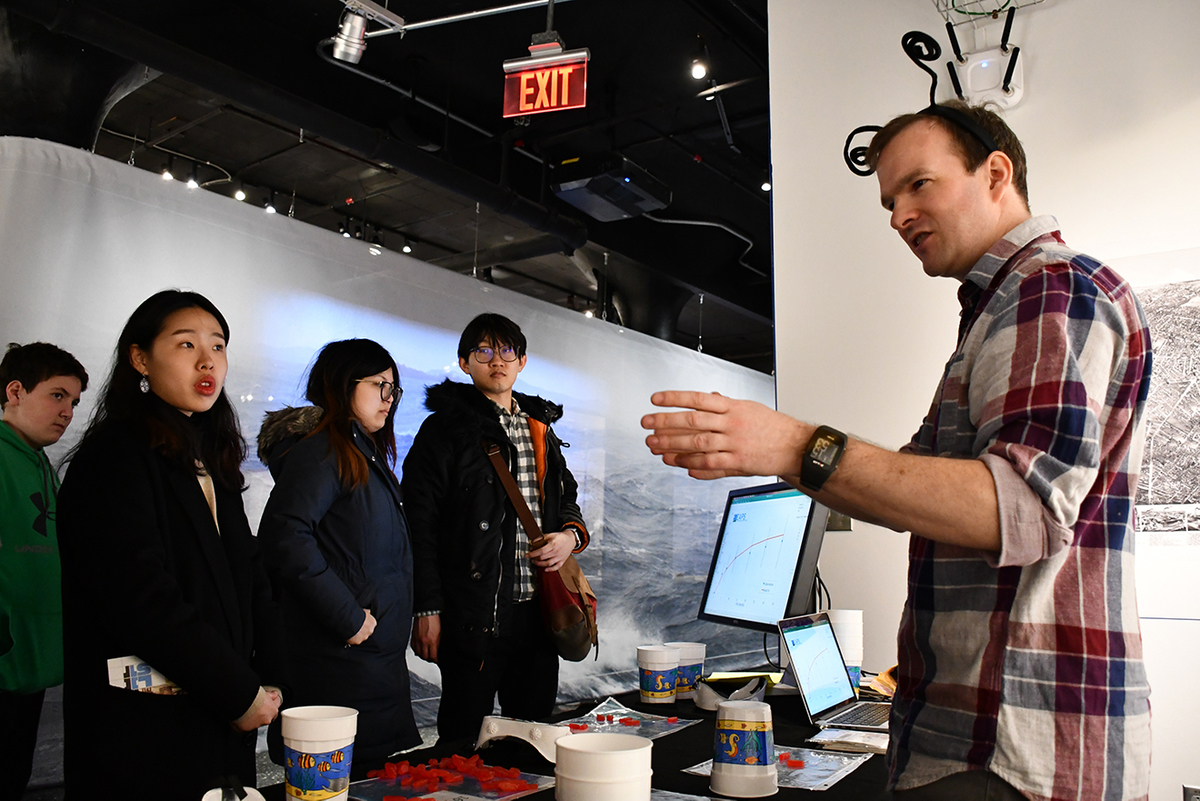
Once averaged, the data fit a curve predicted by Holling, as shown on the screen behind Lauderdale.
In this way, guests could see how predators with little prey (the placemats with 2 or 4 Swedish Fish) spent most of their time hunting for fish unsuccessfully, while those with an overwhelming amount of prey (placemats with 16 or 32 Swedish Fish) had plenty but were limited by how fast they could consumed the prey. This relationship, explained Lauderdale, is how ocean modelers turn marine ecological phenomena, like phytoplankton abundance, into mathematical relationships to model how life in the ocean will behave.


9iGlobeSet-up.jpg (Full)
Across the hall from the Swedish Fish game was the iGlobe display, which shows atmosphere and ocean visualizations on a 2-foot sphere, complete with various interactive GIS compatible datasets. 


11iGlobeWill.JPG (Full)
iGlobe is able to project over 250 movies using near real-time data to show various Earth, oceanic, and atmospheric processes over time. 


10Glen.jpg (Full)
Professor Glenn Flierl helped guests visualize the global dynamics of ocean and atmospheric currents, weather patterns, climate proxies, and more on iGlobe. 


0CoverImage.jpg (Full)
iGlobe allowed guests to explore global circulations, helping them visualize patterns, like the water movement of the Gulf Stream, and how environmental actions in one part of the world impact other parts. 


13iGlobeTeam.jpg (Full)
The iGlobe team at 2019 Nautical Day included (from left) Bill McKenna, a researcher and technician in the Synoptic and Fluid Labs, Professor Glenn Flierl (pointing), and Samuel Levang, graduate student in the Flierl group. 


12iGLobeX.jpg (Full)

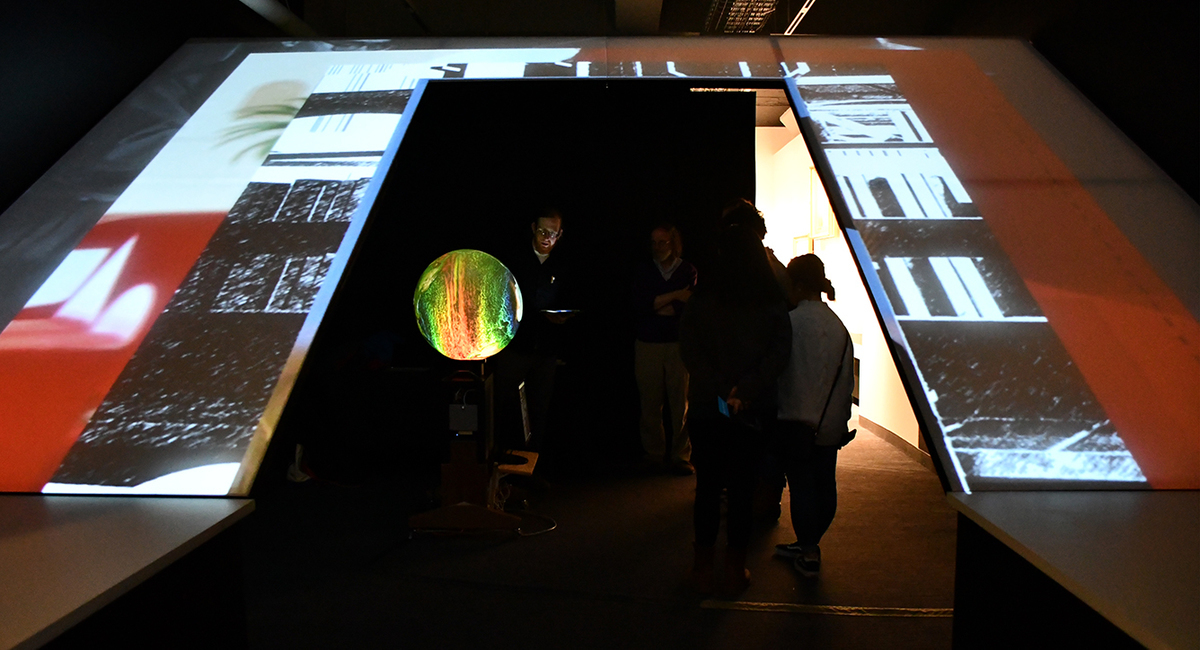
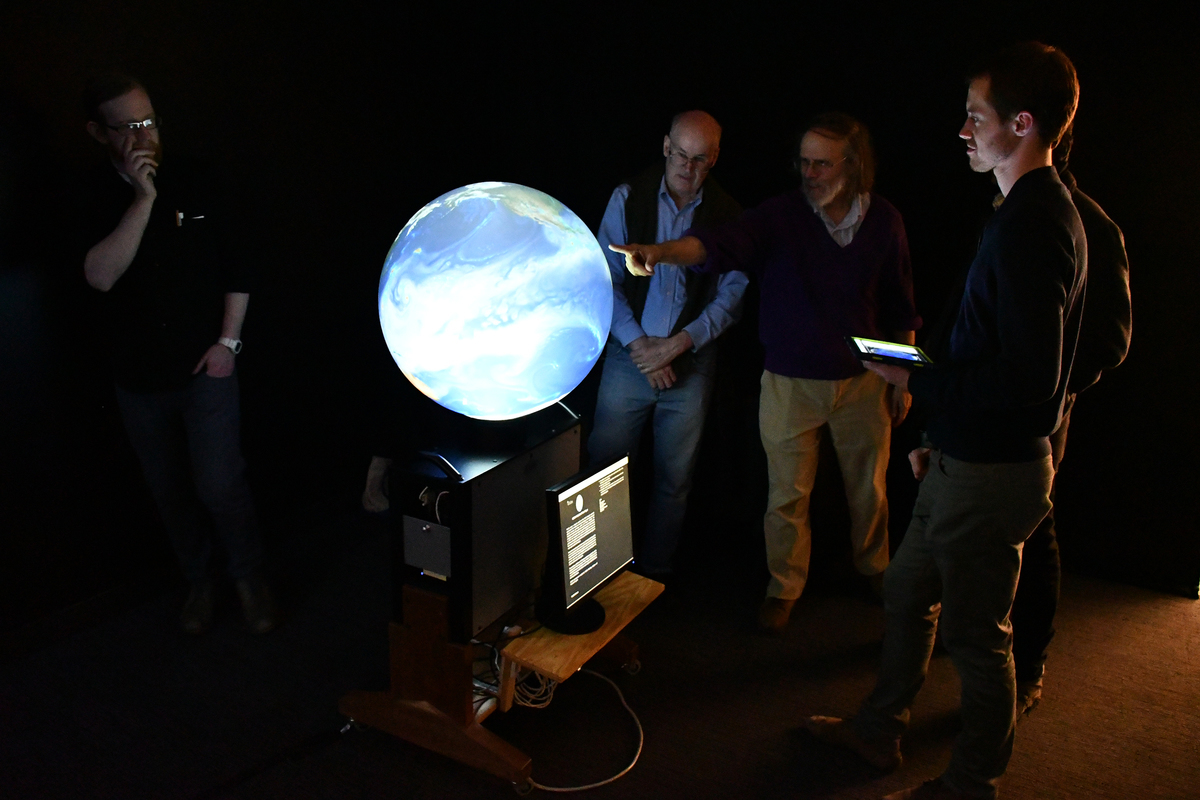
The iGlobe/MIT project is funded by the National Science Foundation.